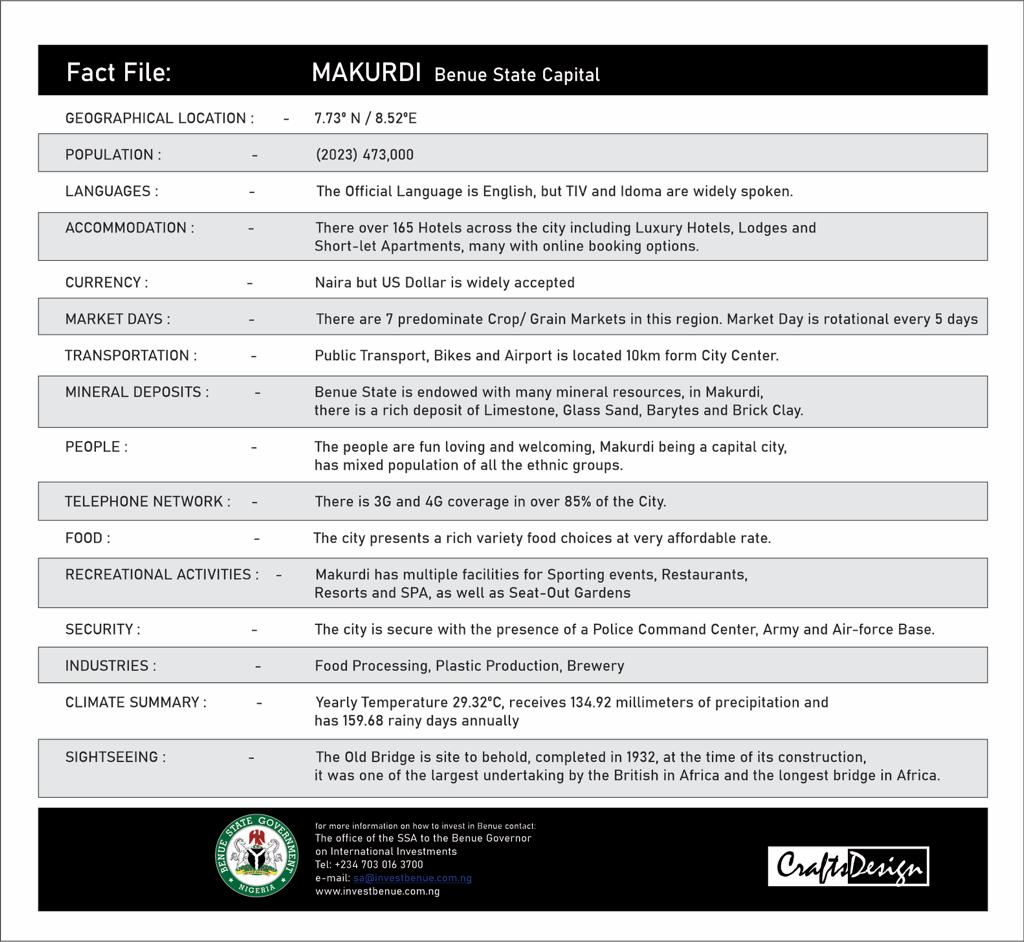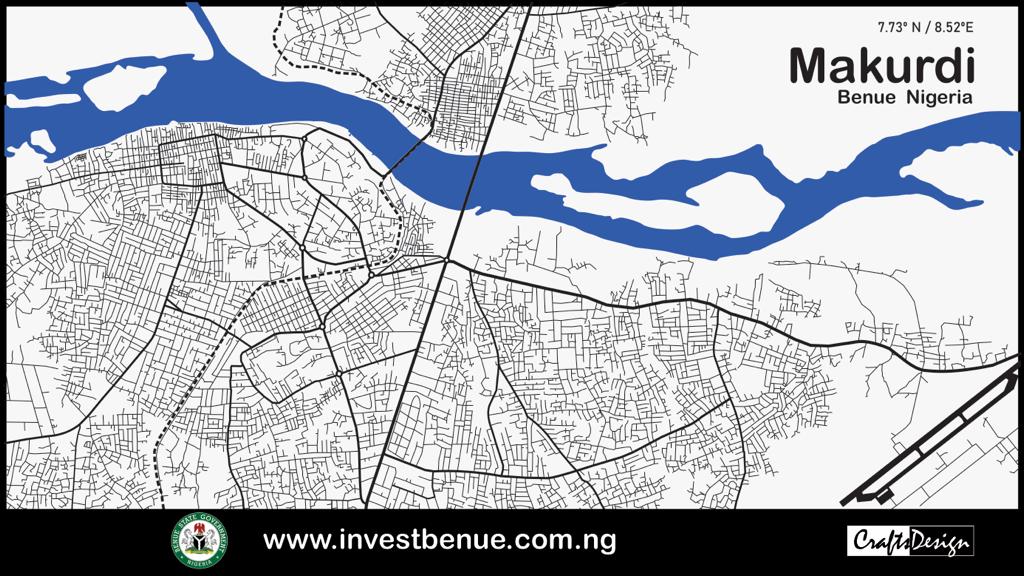

Benue State population across various local governments!


| Name | Status | Population (1991) | Population (2006) | Population Projection (2022) |
|---|---|---|---|---|
| Ado | Local Government Area | 104,137 | 184,389 | 266,200 |
| Agatu | Local Government Area | 95,234 | 115,597 | 166,900 |
| Apa | Local Government Area | 120,000 | 150,000 | 200,000 |
| Buruku | Local Government Area | 130,450 | 206,215 | 297,700 |
| Gboko | Local Government Area | 160,000 | 250,000 | 350,000 |
| Guma | Local Government Area | 116,336 | 194,164 | 280,300 |
| Gwer East | Local Government Area | 117,630 | 168,660 | 243,500 |
| Gwer West | Local Government Area | 74,588 | 122,313 | 176,600 |
| Katsina-Ala | Local Government Area | 100,000 | 150,000 | 200,000 |
| Konshisha | Local Government Area | 120,000 | 180,000 | 250,000 |
| Kwande | Local Government Area | 140,000 | 200,000 | 270,000 |
| Logo | Local Government Area | 110,000 | 160,000 | 220,000 |
| Makurdi | Local Government Area | 200,000 | 200,000 | 400,000 |
| Okpokwu | Local Government Area | 90,241 | 175,596 | 253,500 |
| Oturkpo | Local Government Area | 80,000 | 160,000 | 240,000 |
| Tarka | Local Government Area | 70,000 | 120,000 | 170,000 |
| Ukum | Local Government Area | 150,000 | 200,000 | 300,000 |
| Ushongo | Local Government Area | 120,000 | 180,000 | 240,000 |
| Vandeikya | Local Government Area | 140,000 | 220,000 | 300,000 |
| Name | Status | Population (1991) | Population (2006) | Population Projection (2022) | Computation |
|---|---|---|---|---|---|
| Benue State | State | 2,753,077 | 4,253,641 | 6,141,300 | ... |
Additional Information
Benue State Information
Benue State: state in Nigeria – Inception: 1976 – Official Website
Gender Distribution
Persons:
Gender (C 2006):
Age Group Distribution
Persons:
Age Distribution
Persons:
Age Distribution (2022)
Age Distribution (C 2006)
Source and Explanation
Source: National Population Commission of Nigeria (web), National Bureau of Statistics (web).
Explanation: The population projection assumes the same rate of growth for all LGAs within a state. The undercount of the 1991 census is estimated to be about 25 million. All population figures for Nigeria show high error rates; census results are disputed. Area figures are computed using geospatial data.